

LinkedIn Engagement Metrics: Median Benchmarks for Recruiter Outreach
The engagement metrics that matter most are reactions, comments, reshares, and impressions, and the standard formula to compare posts is ((reactions + comments + shares) / impressions) × 100. Clicks, follower gains, and profile views round out the picture for deeper intent. Organic Page analytics and sponsored Campaign Manager data use different inclusion rules, so we never mix them in one comparison.
***
*TL;DR:
>
- Use impressions when you need frequency weighted exposure, but use unique members reached to measure distinct people; the two denominators answer different questions.
- Before comparing paid and organic posts, normalize results by impressions and align date ranges and audiences, because clicks and included follows differ across reports.
- Set targets from a rolling median over several weeks, segment results by format, and avoid letting viral posts or larger accounts distort expectations.
- Recruiters should check replies and profile views daily, then prioritize relevant engagement within 24 hours; a named hiring manager’s profile view can guide personalized outreach.
***
Table of Contents
- 1. Core LinkedIn engagement metrics and where they appear
- 2. How engagement rates and related formulas are calculated
- 3. Measuring sponsored ads vs organic content
- 4. Benchmarks and realistic expectations for LinkedIn engagement
- 5. Where to pull metrics: dashboards, exports, and the LinkedIn API
- 6. Reporting framework: KPIs, cadence, and how to act on signals
- 7. Utilizing engagement signals to optimize timing for outreach and follow-up
- 8. Impact of LinkedIn algorithm changes on engagement metrics and how to adapt measurement
- 9. Case studies or examples of recruitment professionals leveraging engagement metrics to improve client relationships
- 10. Author perspective: how recruiters and agency teams should apply these metrics
- 11. Track and act on these signals with Kynzo
- FAQ
- Sources
1. Core LinkedIn engagement metrics and where they appear
Every engagement conversation starts with the same handful of numbers, but marketers often confuse the denominator they should be using. *Impressions count every time a post renders on screen, while *members_reached, LinkedIn's reach metric, counts unique members who saw it at least once. Use impressions when you want frequency-weighted exposure and reach when you want to know how many distinct people you touched.
*Reactions (likes and the other reaction types), *comments, and *reshares make up the core interaction trio. Beyond those, LinkedIn tracks *link clicks, *post clicks, *saves, *follows gained from a post, and *profile views attributed to content. Each of these lives in a specific place:
- Impressions, reactions, comments, and reshares appear on the Page Content tab and in the post-level analytics panel.
- Clicks and follower gains from sponsored content surface primarily in Campaign Manager reporting.
- Profile views tied to a specific post show up in post-level analytics as a secondary signal of interest.
- Saves and sends are newer additions tracked at the API level under distinct metric names.
Native Page analytics and third-party reporting tools generally define "engagements" as the sum of clicks, reactions, comments, and reposts, according to LinkedIn's own content analytics documentation . Campaign Manager, however, may include follows in that total for sponsored posts, which is one reason the same post can show two different engagement counts depending on where you pull the number.
For marketers who want to query this programmatically, LinkedIn's memberCreatorPostAnalytics API exposes each of these as a distinct queryType: IMPRESSION, MEMBERS_REACHED, REACTION, COMMENT, RESHARE, LINK_CLICKS, and PROFILE_VIEW_FROM_CONTENT, among others. Knowing these names matters once you move past manual exports and start building your own dashboards.
2. How engagement rates and related formulas are calculated
Once you know the raw metrics, the formula you apply determines whether your benchmark numbers mean anything. The standard engagement rate used across most reporting tools is a ratio of core interactions to total exposure.
- *Standard engagement rate: ((reactions + comments + shares) / impressions) × 100. This is the formula most marketing reporting tools default to and the one to use for apples-to-apples comparisons across posts.
- *Interaction rate including clicks: ((reactions + comments + shares + clicks) / impressions) × 100. Use this variant when a post's goal is traffic or lead generation rather than pure visibility.
- *Weighted engagement rate: some analytics platforms assign comments more weight than reactions on the premise that a comment reflects deeper intent than a quick like. Documentation from Measure describes this weighted alternative and flags that it will produce different totals than LinkedIn's own Analytics dashboard, particularly for sponsored posts where follows get folded into the count.
The memberCreatorPostAnalytics API supports DAILY and TOTAL aggregation options. Choose an aggregation method and apply it consistently across your reporting period.
Lifetime windows smooth out early spikes and late trickles, while fixed-date windows let you compare week-over-week performance. Mixing the two inside a single report is the fastest way to produce numbers nobody on your team can reproduce.
3. Measuring sponsored ads vs organic content
Comparing a boosted post to an organic one without adjusting for how each platform counts engagement produces misleading conclusions. Campaign Manager and Page analytics are built on different inclusion rules, and treating their outputs as interchangeable skews every benchmark you build on top of them.
- Campaign Manager may include follows gained from sponsored content inside its engagement total, while organic Page analytics typically reports follows as a separate metric.
- Click definitions differ between the two systems, so a "click" in Campaign Manager reporting is not guaranteed to match a "post click" in native Page analytics.
- Normalize by impressions, or convert everything to an interaction-rate equivalent, before placing paid and organic results side by side.
- Ads carry metrics with no organic equivalent, including *average CTR and *average dwell time, both of which Campaign Manager's engagement reporting surfaces as dedicated columns.
- Always align time ranges and target audiences before comparing a sponsored campaign's rate to an organic post's rate, since a mismatch in either variable will distort the comparison more than the platform differences will.
4. Benchmarks and realistic expectations for LinkedIn engagement
Averages lie on LinkedIn because a handful of viral posts pull the mean far above what a typical post achieves. That is why benchmark reports and most experienced marketers lean on the median instead, since it reflects what a normal post in a normal week actually earns.
- Medians resist distortion from outlier posts, so they give a more honest baseline for your own targets.
- Smaller accounts with tighter, more engaged follower bases often post higher engagement rates than large accounts, even though the large accounts generate more total engagements.
- Format matters: video and native document posts tend to behave differently from single-image or text-only posts in both reach and interaction rate.
- Set internal targets using a rolling median over several weeks rather than chasing the rate from your single best post.
*Statistic: external guides on LinkedIn analytics point to engagement rate and follower growth as the two metrics marketers should track most consistently when evaluating content strategy over time, since both compound: a healthy engagement rate feeds the algorithm's distribution decisions, and distribution feeds follower growth.
Segmenting your benchmark by format before you report it keeps the comparison fair. A text post and a video post are not competing for the same attention pattern, and lumping them into one average hides which format is actually working.
5. Where to pull metrics: dashboards, exports, and the LinkedIn API
Three places hold the numbers you need: the Page Content tab, post-level analytics panels, and Campaign Manager reporting for anything sponsored. All three let you export CSVs directly from the dashboard, which covers most reporting needs without touching code.
- Start with the Page Content tab for a rolling view of organic performance across all recent posts.
- Open the post-level analytics panel on any individual post for a breakdown of impressions, reactions, comments, reshares, and clicks specific to that piece of content.
- Use Campaign Manager reporting for anything boosted or run as a dedicated ad, since it carries its own metric definitions and columns like average CTR.
- For automated or large-scale reporting, query the memberCreatorPostAnalytics API directly using the queryType values IMPRESSION, MEMBERS_REACHED, RESHARE, REACTION, COMMENT, and LINK_CLICKS, choosing DAILY or TOTAL aggregation based on your reporting cadence.
*Pro Tip: *Treat API output as best-effort reporting data rather than a billing-grade source, since LinkedIn's own documentation does not position it as a reconciliation tool for ad spend.
6. Reporting framework: KPIs, cadence, and how to act on signals
A short list of KPIs, checked on a consistent schedule, beats a sprawling dashboard nobody opens. Track engagement rate (median, not mean), interaction rate including clicks, click-through rate for link-driven posts, follower growth, and profile views. Each one signals something distinct: engagement rate tells you if the content resonates, interaction rate tells you if it drives action, CTR tells you if the offer works, and profile views tell you if people are curious enough to look deeper.
- Check individual post performance soon after publishing, since early results can help you understand how a post is performing.
- Review trend lines weekly to catch format or topic patterns before they go stale.
- Recalculate your rolling median regularly so your internal benchmark reflects recent performance.
- Segment every report by format, by audience, and by paid versus organic before drawing conclusions from it.
*Pro Tip: *When profile views spike after a post, that is usually the strongest signal to act on, far more actionable than a reaction count that tells you little about who actually cares.
7. Utilizing engagement signals to optimize timing for outreach and follow-up
Engagement timing matters as much as engagement volume. A hiring manager who comments on your post, views your profile, or accepts a connection request within a short window after seeing your content is signaling active attention, and that attention fades fast. Waiting a week to follow up on a comment or a profile view means reaching out to someone whose context has already moved on.
Secondary signals like profile views and direct messages often indicate real interest even when they never show up as a visible like or comment, which makes them worth monitoring separately from public interaction counts. For recruiters and business developers, a profile view from a specific hiring manager within hours of a relevant post is a far stronger outreach trigger than a generic cold message sent on a fixed weekly schedule.
Practical sequencing looks like this: monitor replies and profile views daily rather than weekly, prioritize outreach to anyone who engages within the first 24 hours of a post going live, and treat a connection accept following an engagement as the cue to send a personalized message rather than a template done. Reacting inside that window, rather than batching follow-ups once a week, is what separates outreach that lands from outreach that gets ignored.

8. Impact of LinkedIn algorithm changes on engagement metrics and how to adapt measurement
LinkedIn's distribution algorithm shifts periodically, and when it does, your historical benchmarks can become unreliable almost overnight. A post format that performed well last quarter can see impressions drop even though the content quality has not changed, simply because the platform recalibrated how it distributes certain formats or rewards certain early engagement patterns.
The practical fix is to treat your internal benchmarks as rolling, not fixed. Recalculate your median engagement rate monthly rather than relying on a number you set six months ago, and watch for sudden shifts in the ratio between impressions and interactions, which often signal an algorithm adjustment before any official announcement does. If reach drops sharply across most of your recent posts while interaction rate on the posts that do get seen stays stable, that pattern points to a distribution change rather than a content problem.
Because aggregation choices (DAILY versus TOTAL in the API) and dashboard reporting windows can mask these shifts, compare like periods: a 30-day window against the prior 30-day window, not a single viral post against a quiet week. Keeping your measurement window consistent is what lets you separate a genuine algorithm effect from normal week-to-week variance.

9. Case studies or examples of recruitment professionals leveraging engagement metrics to improve client relationships
Recruiters who build client relationships on LinkedIn generally succeed by treating engagement data as a prioritization filter, not a vanity number. A search consultant tracking which hiring managers comment on, reshare, or repeatedly view their posts can rank outreach targets by actual signal strength instead of guessing who might be receptive.
In practice, this looks like watching a target account's engagement pattern over several weeks: a hiring manager who reacts once might be a passive follower, but one who comments twice and then views your profile is showing an escalating interest curve worth acting on. Recruiters who map that curve to specific outreach moments, rather than sending a cold InMail on a fixed schedule, tend to open conversations with warmer context because the first message can reference the actual post or comment that triggered the signal.
The same logic applies to client retention. An account manager who notices a client contact consistently engaging with company updates has a natural opening for a check-in conversation that does not feel like a sales call. Engagement data, read this way, becomes less about proving content performance and more about knowing exactly when a relationship is ready for the next step.
10. Author perspective: how recruiters and agency teams should apply these metrics
We think the biggest mistake agency teams make is treating every engagement the same. A reply or a profile view from a named hiring manager is worth more than a hundred anonymous impressions, and prioritizing outreach by that signal, rather than by broad audience metrics, can help turn content into pipeline. Routing those signals into a dedicated feed and syncing them to your CRM converts a scroll session into a task list.
*— Jenny
11. Track and act on these signals with Kynzo
Reading engagement metrics is only half the job. Turning a profile view or a comment reply into a warm conversation at the right moment is the part most recruiters struggle to operationalize, which is exactly what we built our workflow around.

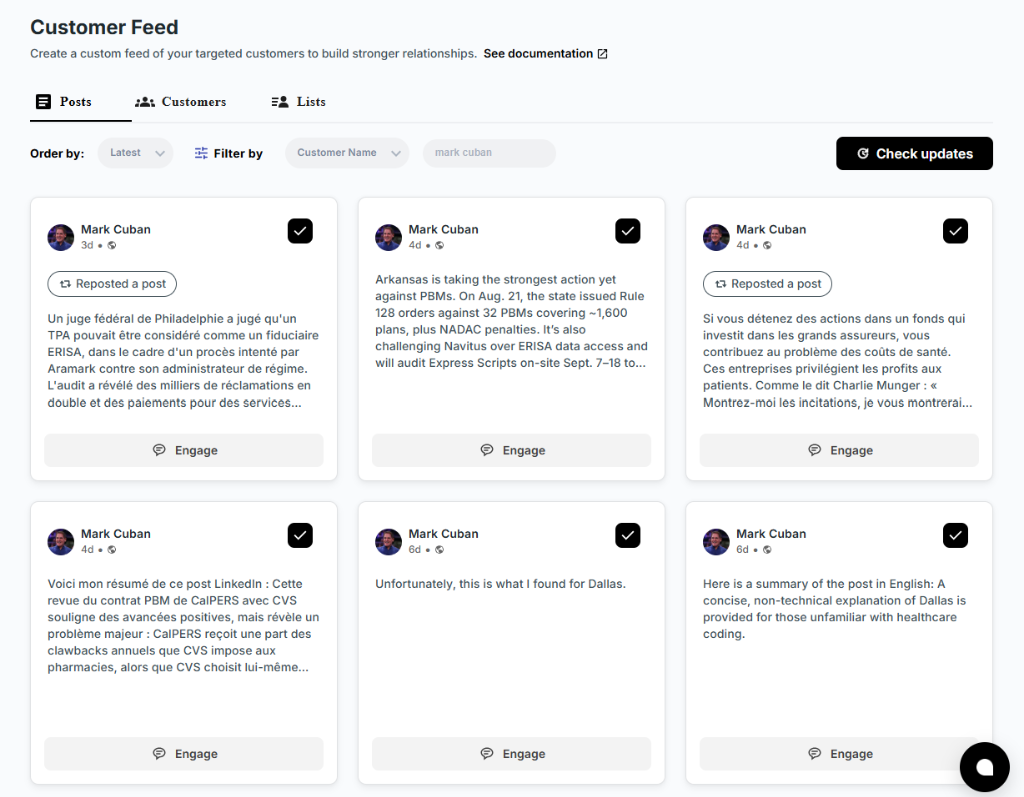
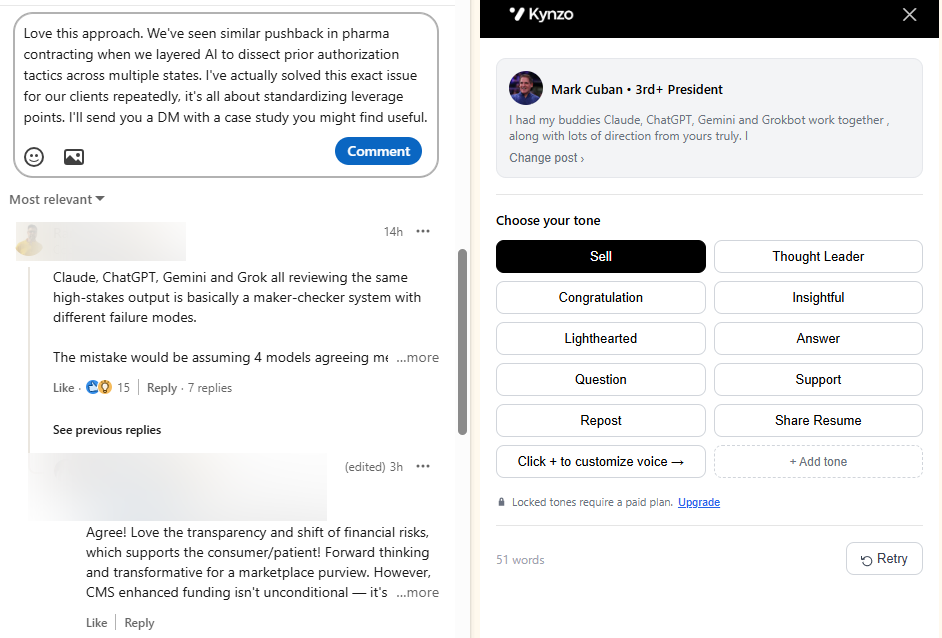
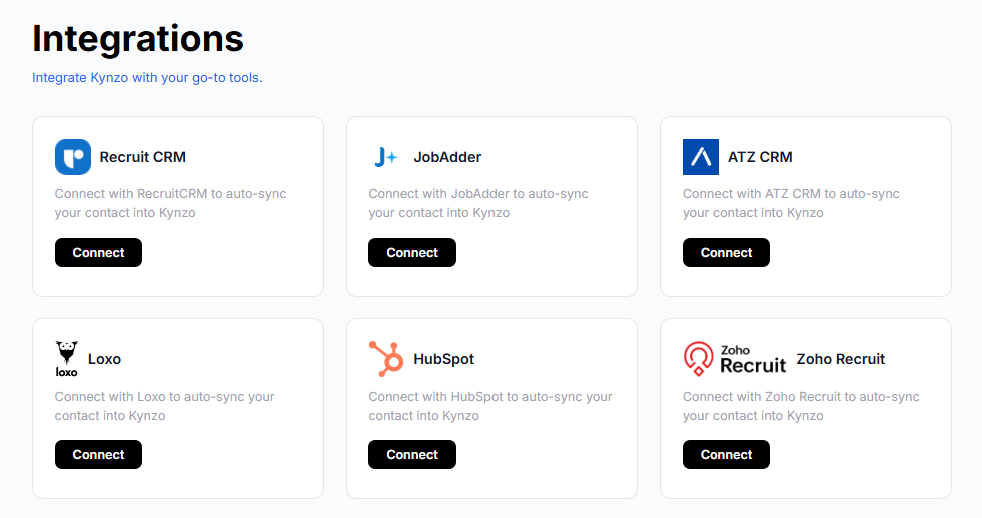
Our Chrome extension and dedicated Customer Feed track replies, comment likes, profile views, and connection accepts from the hiring managers and company accounts you actually care about, instead of burying them in LinkedIn's general feed. We sync target accounts directly from recruiting and CRM systems like Recruit CRM, JobAdder, Zoho Recruit, HubSpot, Crelate, and Loxo, and our AI Agent drafts or publishes context-aware comments in your own voice with human-pacing controls like active hours and randomized delays.
- Monitor engagement signals from specific targets in one feed instead of scrolling LinkedIn's main timeline.
- Sync accounts automatically from your existing CRM or save profiles manually.
- Let the AI Agent draft or publish comments using your voice and pacing preferences.
- Spot warm outreach moments when a reply, profile view, or connection accept comes in.
If you want to see how this fits your own pipeline, our pricing page outlines the STARTER, PRO, and ELITE plans, or you can start with our free LinkedIn™ Comment Generator to try the commenting workflow firsthand.
FAQ
What is the 3-2-1 rule on LinkedIn?
The 3-2-1 rule is a content habit some LinkedIn creators follow: engage with other posts, comment meaningfully, and publish a post of your own regularly. It is a posting discipline rather than an official LinkedIn metric or algorithm rule.
Is 2.5% engagement rate good?
A 2.5% engagement rate, calculated as ((reactions + comments + shares) / impressions) × 100, generally sits above what many accounts see on an average post, since benchmark guidance treats the median as the more realistic comparison point than the mean. Whether 2.5% counts as strong for your account depends on your typical format mix and follower size, so compare it against your own rolling median rather than a single external number.
What is a good engagement rate percentage on LinkedIn?
There is no single universal figure, because rates vary by account size, industry, and post format, and because a few viral posts can distort any average-based benchmark. The more reliable approach is tracking your own median engagement rate over a rolling period and treating that internal baseline, segmented by format, as your target.
Is 10,000 impressions a lot on LinkedIn?
Whether an impression count is high or low depends entirely on your account's typical reach and follower count, since impressions scale with audience size and distribution rather than against a fixed threshold. A better question is how that impression count converts into interactions using your engagement rate formula, since a smaller impression count with a high interaction rate can outperform a larger one with low engagement.
Where can I find my LinkedIn engagement metrics?
Organic metrics live on your Page's Content tab and in post-level analytics panels, while sponsored content metrics appear in Campaign Manager reporting, which uses different inclusion rules for follows and clicks. For programmatic access, the memberCreatorPostAnalytics API exposes the same metrics by name for custom dashboards.
Sources
- Member Post Statistics - LinkedIn | Microsoft Learn
- LinkedIn Content Metrics in Measure | Social Media Management | Help Center
- Sproutsocial